
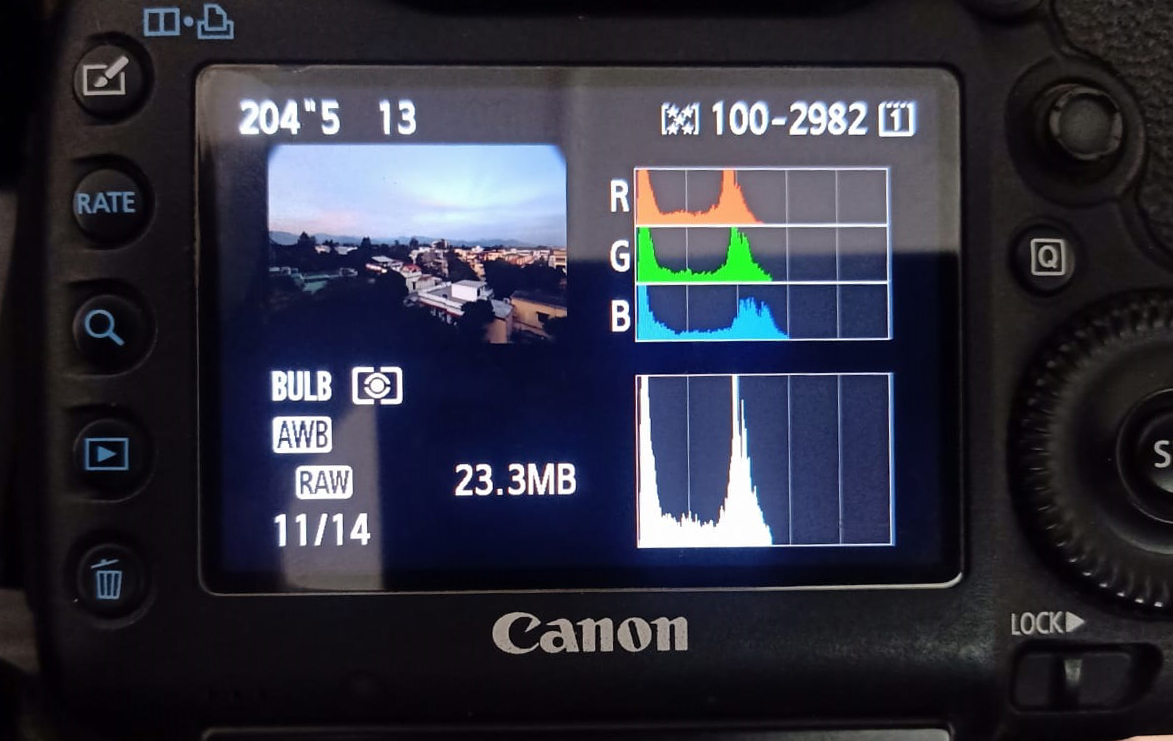
 A histogram is basically a graph that show how brightness levels are distributed in a photograph. The brightness of a certain pixel is plotted on the horizontal x-axis and is given a number of 0 to 255 with intermediate values in between wihich are midtones. O is pure black and 255 is pure white. There are 256 levels in a raw file. The number of pixels of a certain shade or level is indicated by the hieght of the column in the graph. Therefore if there are lots of distribution of pixels on left side of the graph then photo will be underexposed and if there pixels are distributed on the right side of the graph then photo will be overexposed. For a correctly exposed photograph of an average scene, there should be some pixel distribution in areas of pure black, in pure white and an even dsitribution of pixels between these two.